Introduction:
During the continuing government shutdown, a problem began to
arise within the Geographic community. Reliance upon the United States
Geological Survey (USGS) for gathering spatial information has begun to put a
toll on GIS users within academia and the private sector alike. Creative
methods of data collection have to be pursued to overcome such a dilemma. In
this blog post I will cover the use of ASTER DEM data provided by Japan, to
create a three dimensional model of the World War I Verdun battlefield.
Background Information
As mentioned above, relying on a single source for spatial data is
considered poor practice within the geographic community. This reliance not
only causes a dilemma in the wake of a government shutdown, but also exclude
other valuable resources that should be considered. Our search for
different distributors of spatial data brought us to a collaborative project by
the Ministry of Economy, Trade, and Industry of Japan (METI), and the United
States National Aeronautics and Space Administration (NASA). METI and
NASA are jointly developing a publicly accessible digital elevation model
using the Advanced Spaceborne Thermal Emission and Reflection Radiometer
(ASTER) satellite. ASTER provides land
coverage between 83°N and 83°S with a resolution of 1 arc-second (30 meter) at
a 95% confidence level (Group on Earth Observations). This data offers a suitable alternative to the
USGS in providing accurate and precise elevation data.
Methods
To begin collecting data I will direct you to the website where
you will create a login account used to access the tiles of your study area. http://gdem.ersdac.jspacesystems.or.jp/login.jsp. Once your
account has been set up, navigate to the homepage by clicking ASTER GDEM at the
top of the page. The tiles are accessed by selecting "Search" located
on the side tab of the homepage. This should bring up an interactive map
sectioned off by square tiles (Figure 1).
 |
| Figure 1: Interactive map used during the tile selection process. The four selection methods are listed at the top of the webpage under the search header. To select a method, use the tabs located above the map. |
Use the map to zoom to your area of interest
(AOI). For the purposes of my class our study area is a single tile located in
Eastern France at roughly 5°W and 49°N. The interactive map has four methods of
tile selection depending on the size of your study area. You can select the
tiles of your AOI directly, select the tiles of your AOI by creating a polygon
around it, use an existing shapefile containing the extents of your study area,
or if you know the coordinates you can select the tile at that location. I used
the select tiles directly method while paying attention to the coordinates of
the cursor in the lower left hand corner of the map.
Once you found the tile(s) within your AOI, click start located above the map to begin the selection process. After selecting your tiles, click next below the map to bring up your selection queue and click next again. If you are not already logged in, you will be prompted to do so otherwise you will be directed to the ASTER GDEM terms of use and policy agreement. It is very important that you select disaster as your purpose for the download as disaster relief/mitigation is the primary intended use of the data. After selecting agree you can begin the downloading process. Navigate to your download and extract the files to your desired directory. This ends the data collection process for obtaining ASTER elevation data.
Once you found the tile(s) within your AOI, click start located above the map to begin the selection process. After selecting your tiles, click next below the map to bring up your selection queue and click next again. If you are not already logged in, you will be prompted to do so otherwise you will be directed to the ASTER GDEM terms of use and policy agreement. It is very important that you select disaster as your purpose for the download as disaster relief/mitigation is the primary intended use of the data. After selecting agree you can begin the downloading process. Navigate to your download and extract the files to your desired directory. This ends the data collection process for obtaining ASTER elevation data.
Now
that you have collected your data, it can be imported into a GIS for
manipulation and analysis. For our intended purposes we wanted to create a
three dimensional model of the Verdun battlefield showing just how crucial it
was for both combative forces to secure the north and south ridgelines east of
the Meuse River. Since the tiles downloaded using the process above covered a
larger area than necessary, the clip function was used to extract only my AOI.
Using a separate raster, I designated the extent of the battlefield to create a
new, smaller elevation raster. Figure 2 shows an overlay of my DEM clip on top
of the ASTER tile.
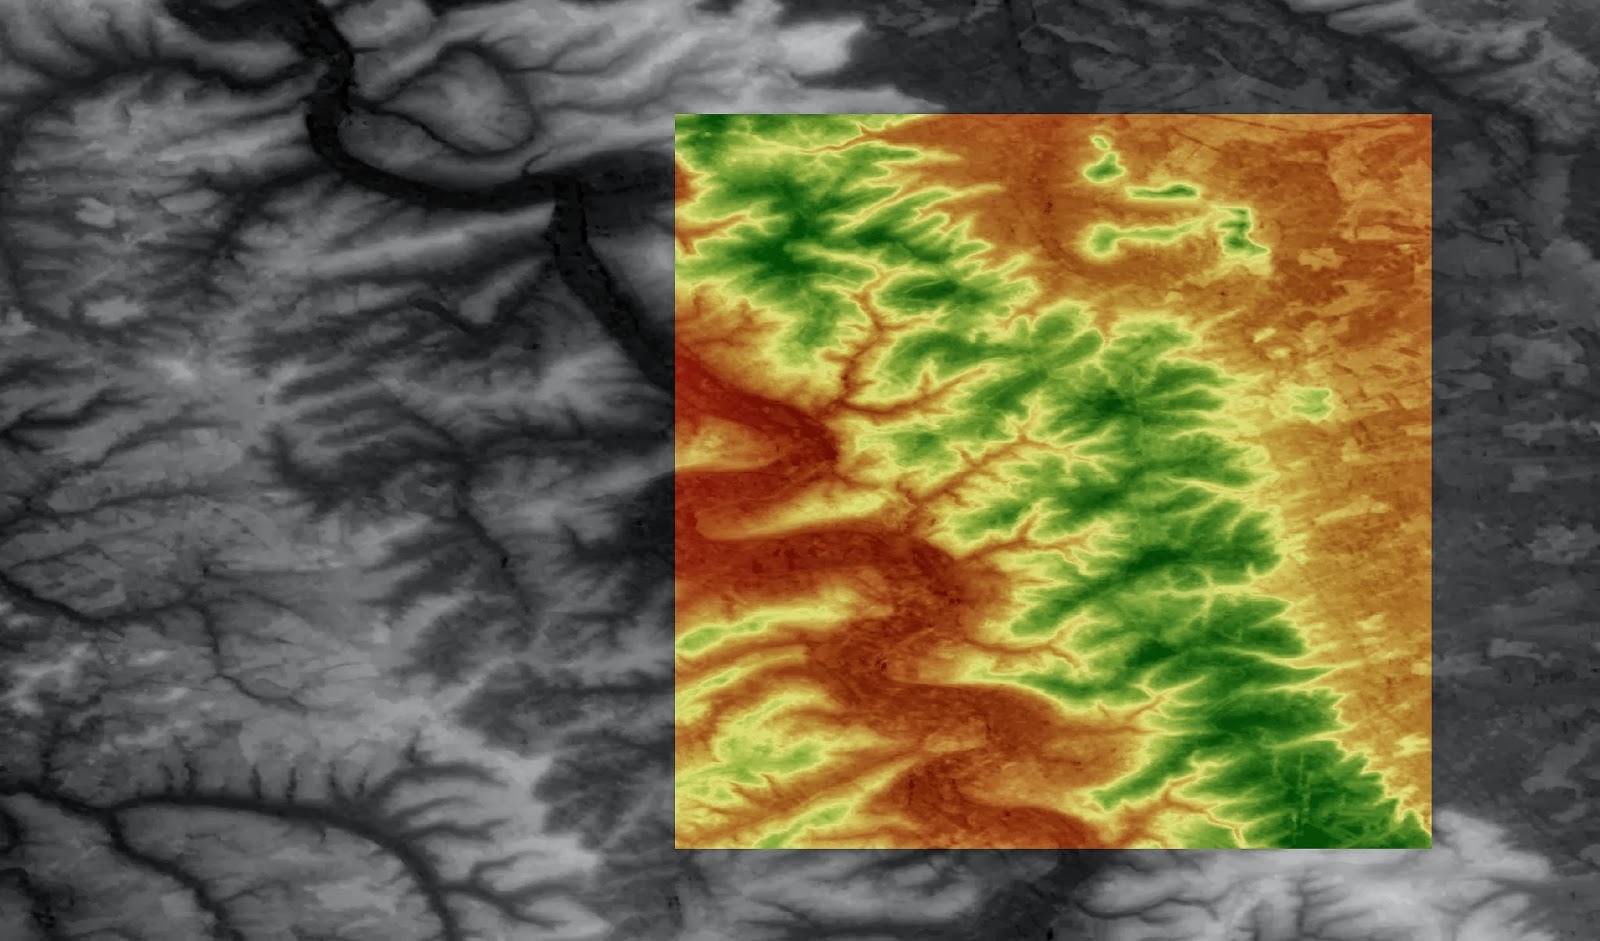 |
| Figure 2: A DEM clip (red to green diverging, dark) overlay on top of downloaded ASTER tile. The clip was created using a georeferenced raster of the Verdun battlefield |
After
creating the DEM clip of our AOI, it was imported into ArcScene to visualize
the battlefield in three dimensions. When downloading data from the GDEM
website, it comes preset to the WGS84 spatial reference. To ensure spatial
integrity, the raster was re-defined and projected using the ETRS 1989 datum in
UTM zone 31 North. Once the raster has been projected, it can be set to float
on a custom surface within the layer properties, designating each pixel value
from the DEM to represent change in elevation (Figure 3).
 |
| Figure 3: Setting base heights to float on a custom surface within the layer properties dialog box. This will create the three dimensional surface desired for the model. |
Once
the raster has been set to float on a custom surface, it can be viewed in three
dimensions. If for any reason your raster is not a three dimensional model, you
may have to change the vertical exaggeration located in the general tab of the
scene properties (Figure 4). If vertical exaggeration is set at zero, it will show
no change in elevation which is obviously not an accurate depiction of Earth's
surface. A vertical exaggeration set at "none" will maintain the
elevational scale of 1:1; whereas, a vertical exaggeration set at "5"
will embellish the changes in elevation five to one.
 |
| Figure 4: Setting the vertical exaggeration to emphasize changes in elevation. To view the model in 3D, make sure your models vertical exaggeration is not set to zero. |
Results
Additional
features within ArcScene may be used to enhance the quality of your model. Changing the raster surface resolution can
help in achieving either a "smoother" or more pronounced image
(Figure 5 and Figure 6).
 |
| Figure 5: A smooth surface model using large X and Y cell sizes to show smooth changes in elevation |
 |
| Figure 6: A rough surface model using a majority of the DEM's pixel values to depict changes in elevation. |
 |
| Figure 7: Rendering the raster in a continuous, stretched color scheme to enhance the surface elevations. |
 |
| Figure 8: Rendering the raster in a classified color scheme to detect suitable locations of battlefield defensive locations. |
Conclusion
Elevation
data within a GIS has a number of practical uses. In future blog posts, I will
continue to explore the Verdun battlefield by using various tools such as
slope, aspect, and viewshed analysis.
Although I initially encountered the dilemma of losing the USGS as a
data source, it was easily overcome by a quick search online. This brings me to
my second point.
Collecting
data from multiple sources should be considered best practice within the
geospatial discipline. It offers a wide range of discretion to influence the
integrity of your model. Reliance on a
single developer may be hazardous, acting as a limiting agent to your methods.
Creditable alternatives exist beyond the conventional hosts such as USGS and
the US Census Bureau. A quick google search came up with a number of sites
distributing their data at no costs. Within the scope of my studies, these
sources will be a valuable asset to my understanding of the Verdun battlefield.
ASTER information
ASTER information
Data sources
No comments:
Post a Comment